
Lucrecia Dalt, 2019 live performances
Data visualization for Lucrecia Dalt, mapping her live shows around the world.
Have you ever wondered how many people go to see a musician perform in a year? What path that such an artist follows while touring around the world? This visualization project explored these questions and more, highlighting deeper stories behind performance art.
Lucrecia Dalt is an experimental musician based in Berlin. She performs around the world for a wide variety of audiences. She can perform for hundreds or thousands of people in Los Angeles or Barcelona, then play for a group of 5 people in an intimate art gallery in Copenhagen. Her shows vary in form and shape.
In 2019, I helped Lucrecia collect all the data related to her live performances. This is what the raw data looked like at the end of that year.

Lucrecia Dalt live performances data set with 54 entries and 6 categories.
Using those data, we crafted a short video that describes the year of performances. I was in charge of the visual storytelling, and Lucrecia composed the original music and took care of the final sound effects.
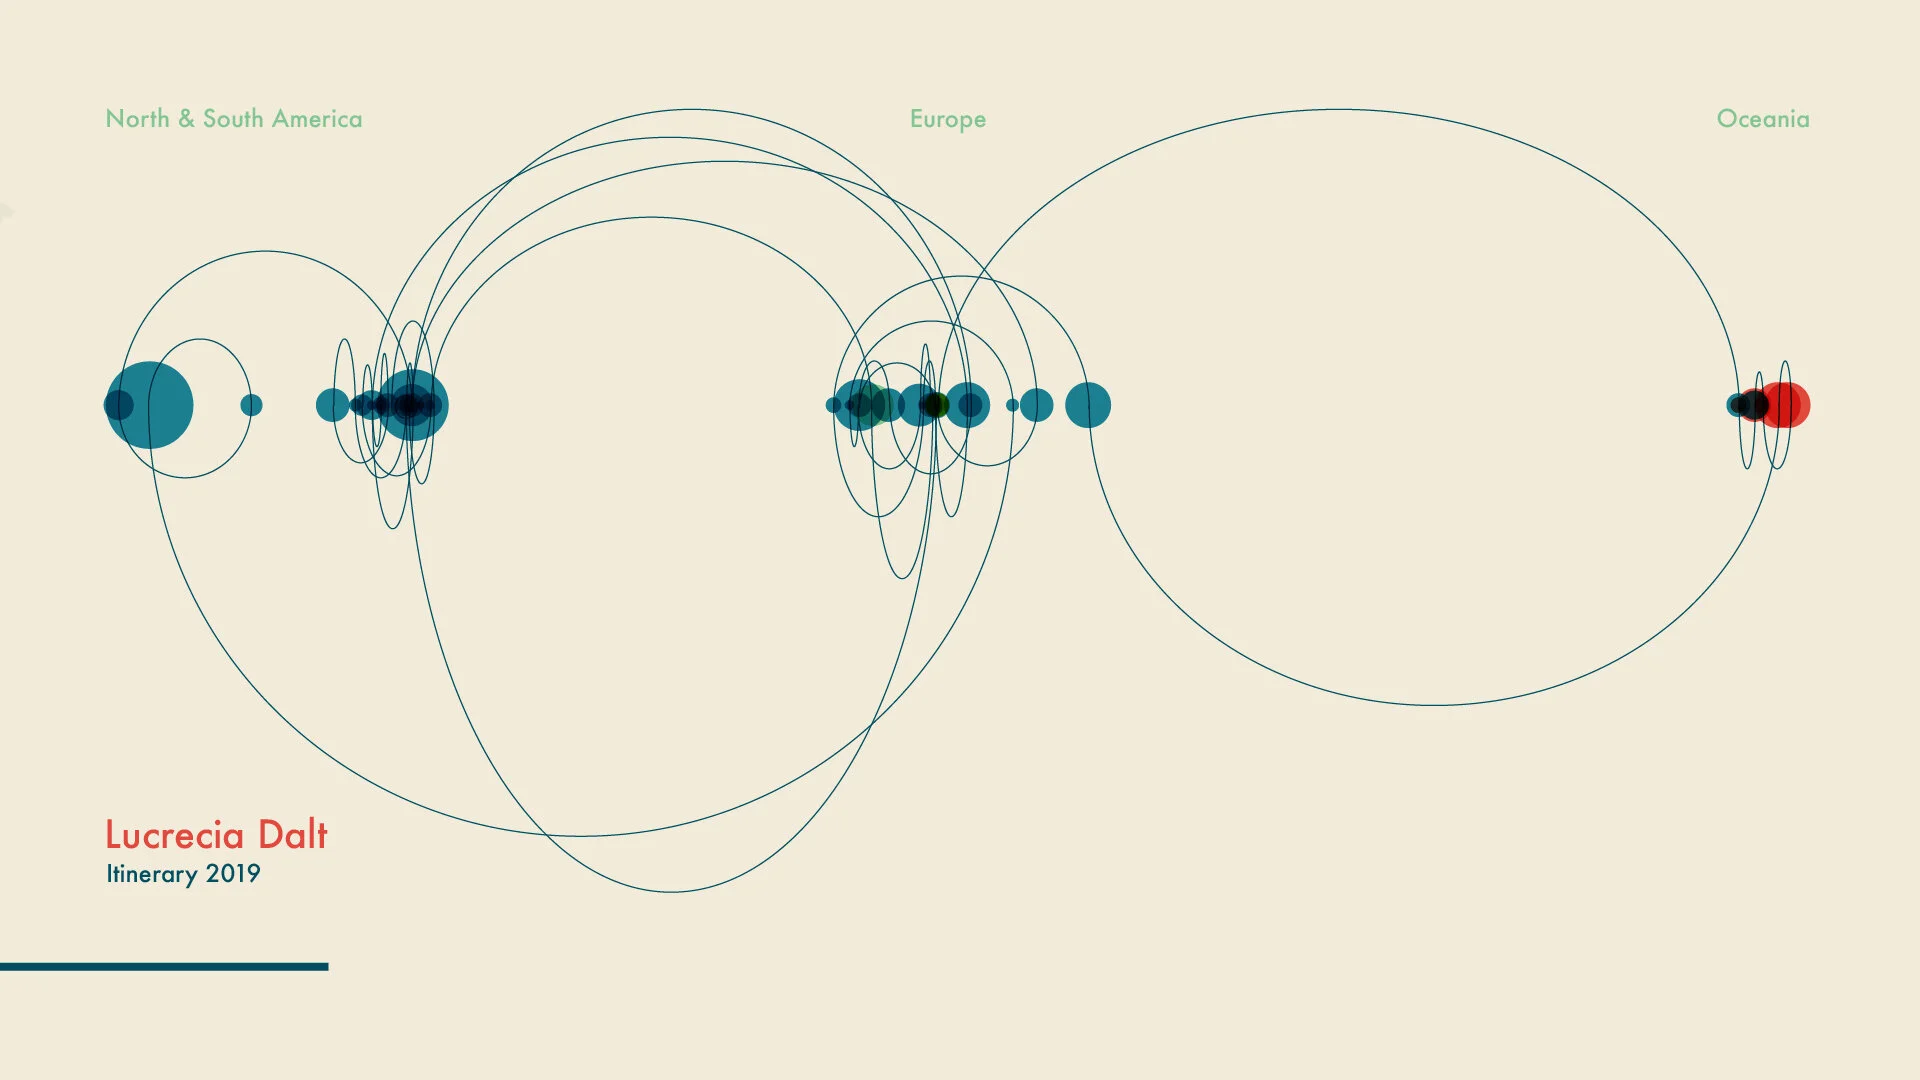
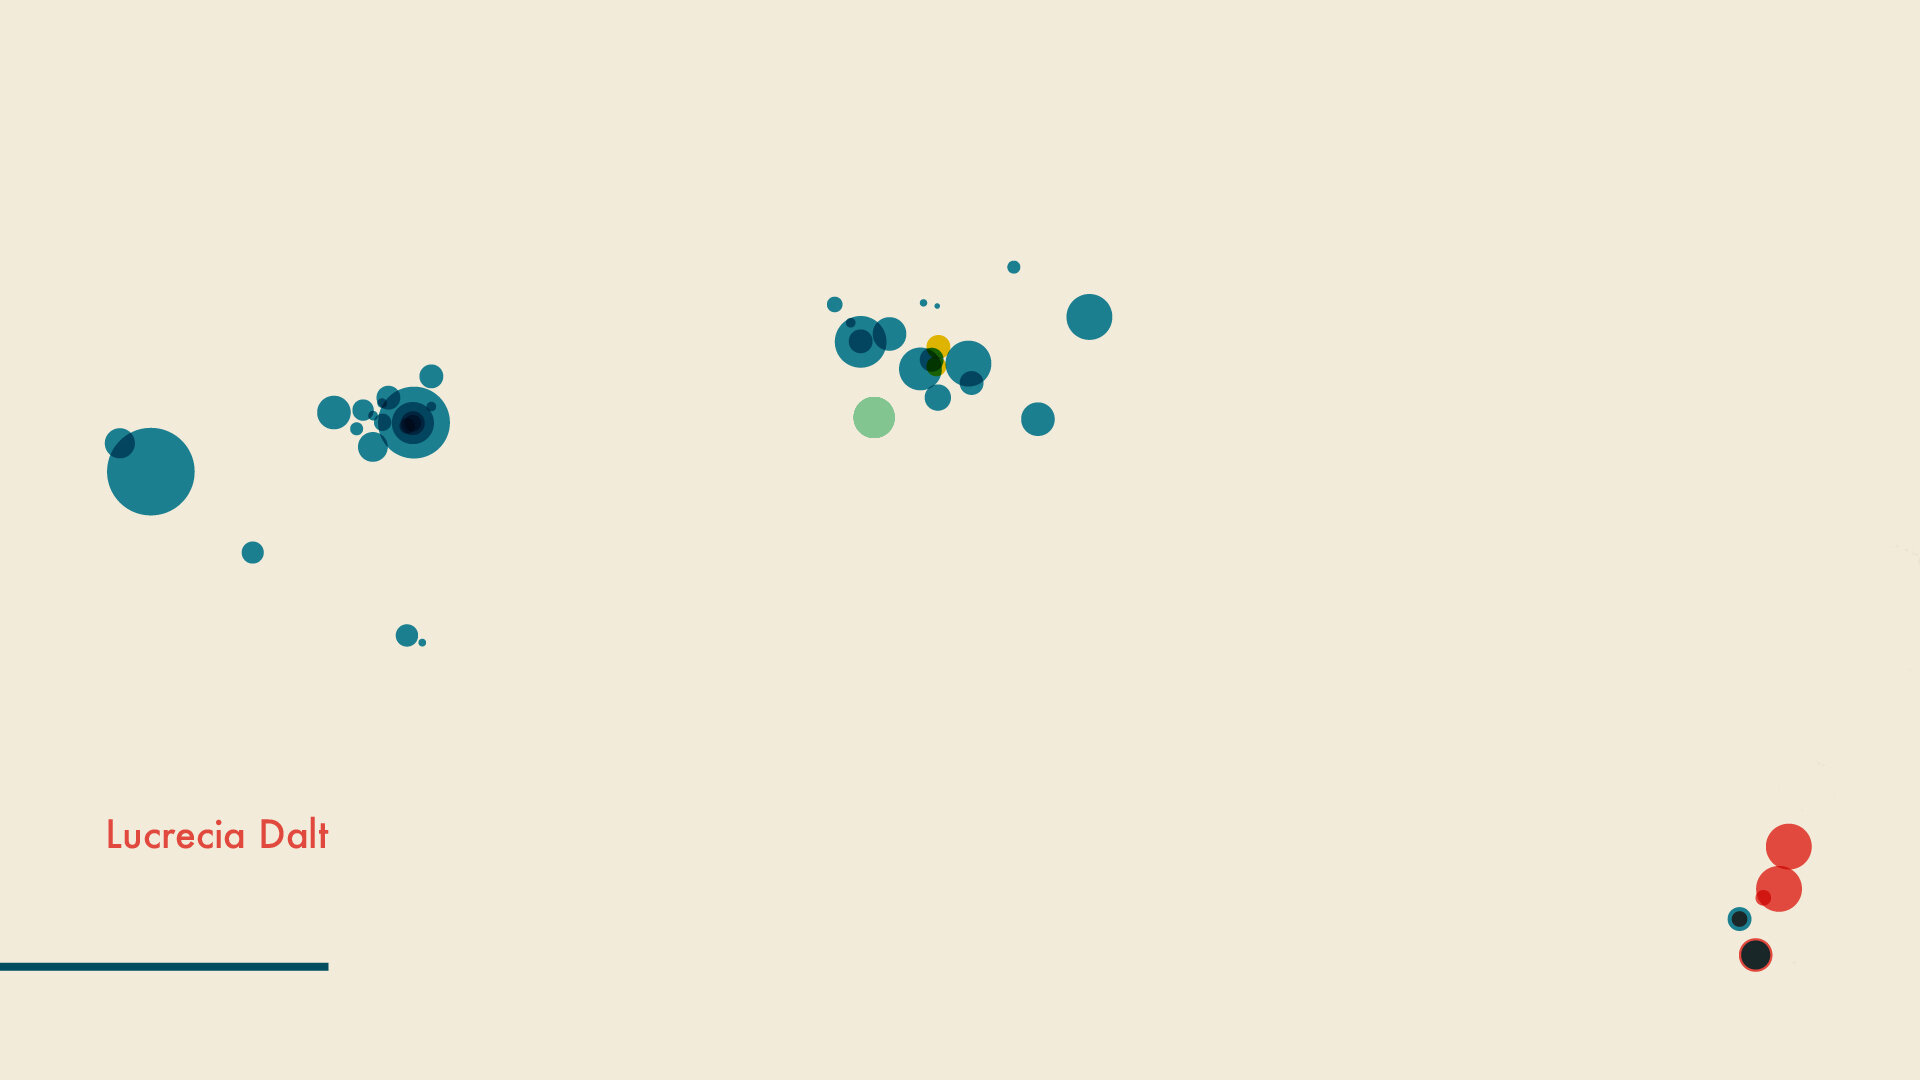
The visual story is told from different standpoints, including both geographical localization and chronological paths. Charts appear along with music, and more than nine individual graphics were utilized as part of the entire visual story.

The visual system – made of geometric elements and a primary-color based palette – functions as a connection to Lucretia’s music as well as avant-garde movements of the early 1900; one of the origins of experimental music.


Key Words:
Concept Work, Data Visualization, Art Direction, Typography, Animation.
Tools:
Tableau, Adobe After Effects, Adobe Illustrator.
Credits:
Music and sound effects: Lucrecia Dalt.
Design, Art Direction, Data Visualization, and Animation: Catalina Plé.