Decade Volcanoes
Data visualization and illustration. Mapping some of the most destructive active volcanoes arroud the globe.

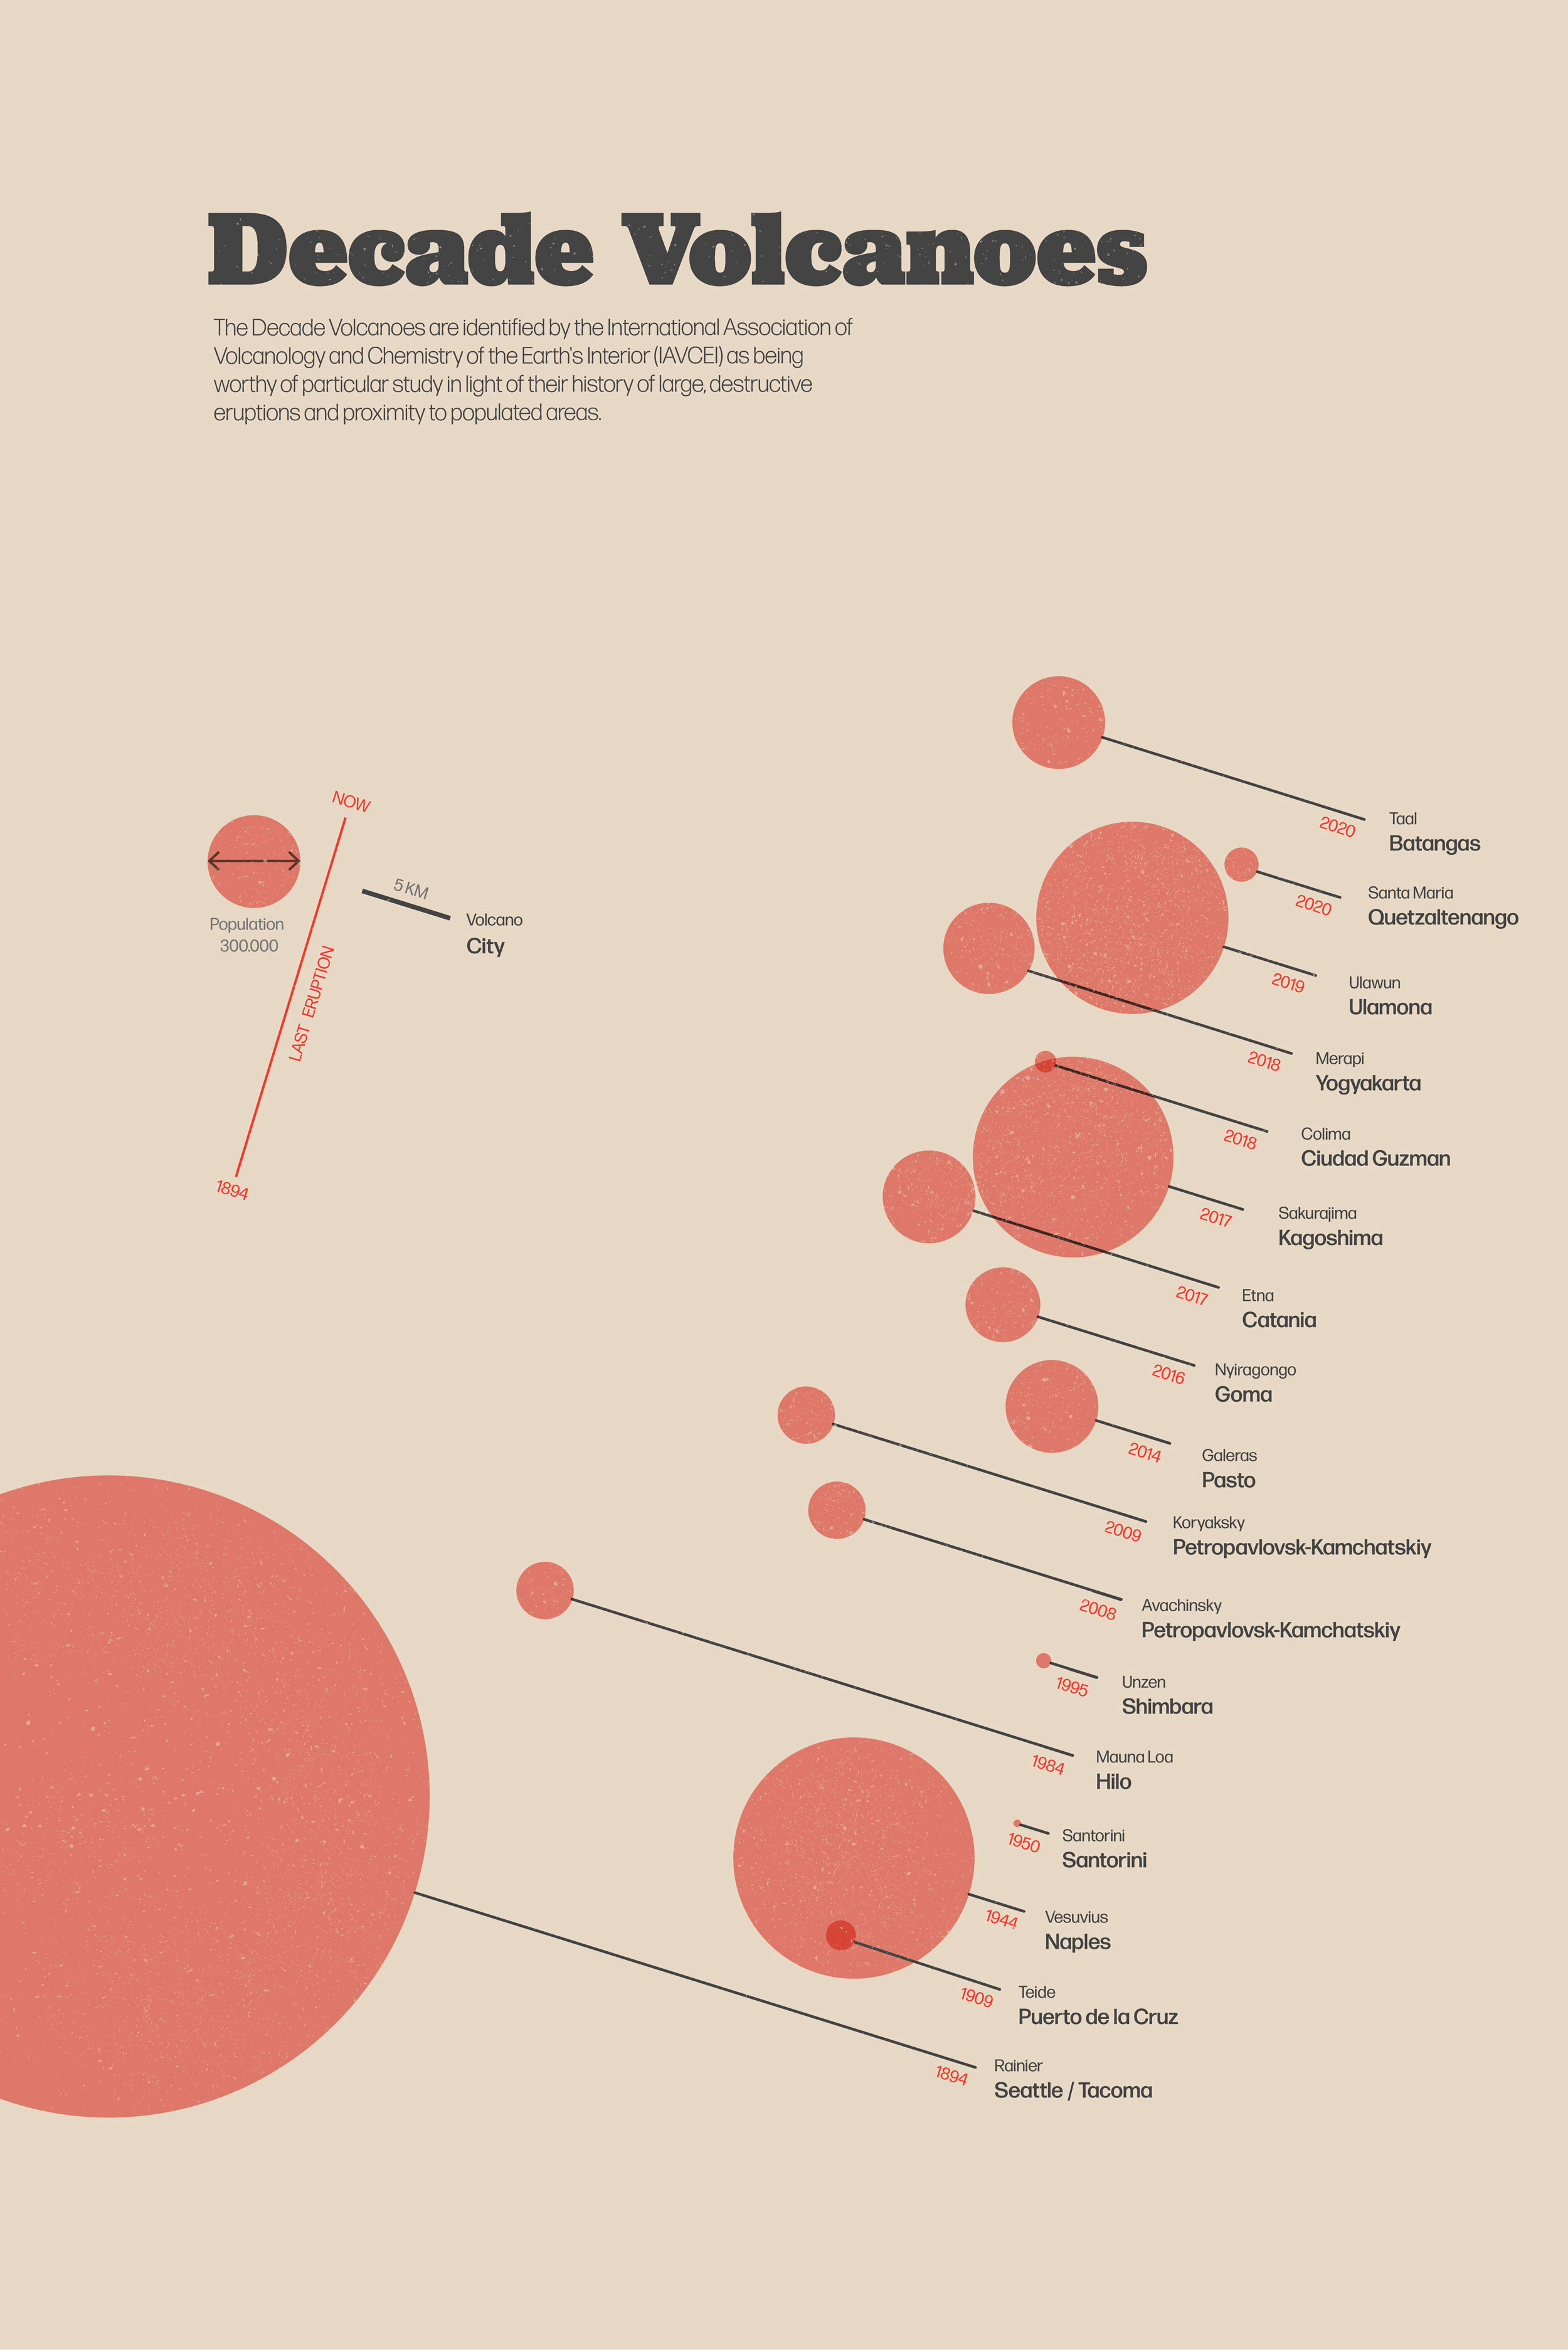
Did you know that there are about 1,500 active volcanoes worldwide? From this long list, only 17 have been deemed worthy of particular study in light of their history of large, destructive eruptions and proximity to populated areas.
They are known as the Decade Volcanoes and are scattered all around the world. In this Data Visualization project, we are given the opportunity to learn more about these incredible elements of our natural world.
In the first visualization series, we examined the year of each volcano's most recent explosion, the population that would be affected in an eventual eruption, and the distance between the community and the volcano.
A collection of individual vignettes that depict specific data about each volcano, such as its topography, the eruptive history timeline, and its appearance, are the next part of the series.


Key Words:
Concept Work, Data Visualization, Illustration, Art Direction, Typography.
Tools:
Tableau, Adobe Illustrator, Affinity Designer.
Credits:
Data: Smithsonian Institution, Global Volcanism Program. Texts references from Wikipedia. Illustration, Data Visualization, and Art Direction Catalina Plé.